An Interactive Visualization of U.S. Aborition Data
An experimental data visualization project done in Figma about estimated number of
abortions in each state ranked from 2017 to 2023
Project Details
I was tasked with choosing a dataset of any type and creatively visualizing it in
Figma. I chose to represent abortion data from pre-pandemic, the beginning of the pandemic, and the most
recent to-date data I could find of 2023. I ranked each state by their rates and reranked them for each year
onwards, highlighting trends and full stops for those states that experienced bans and therefore lost any
sort of official data. I wanted this to be interactive to keep users' attentions and simple enough for
anyone to follow. I chose the for the topic being closely related to women's health and for the sharp
contrast between that pink and the black bars that bans created in the graphic.
Image Gallery
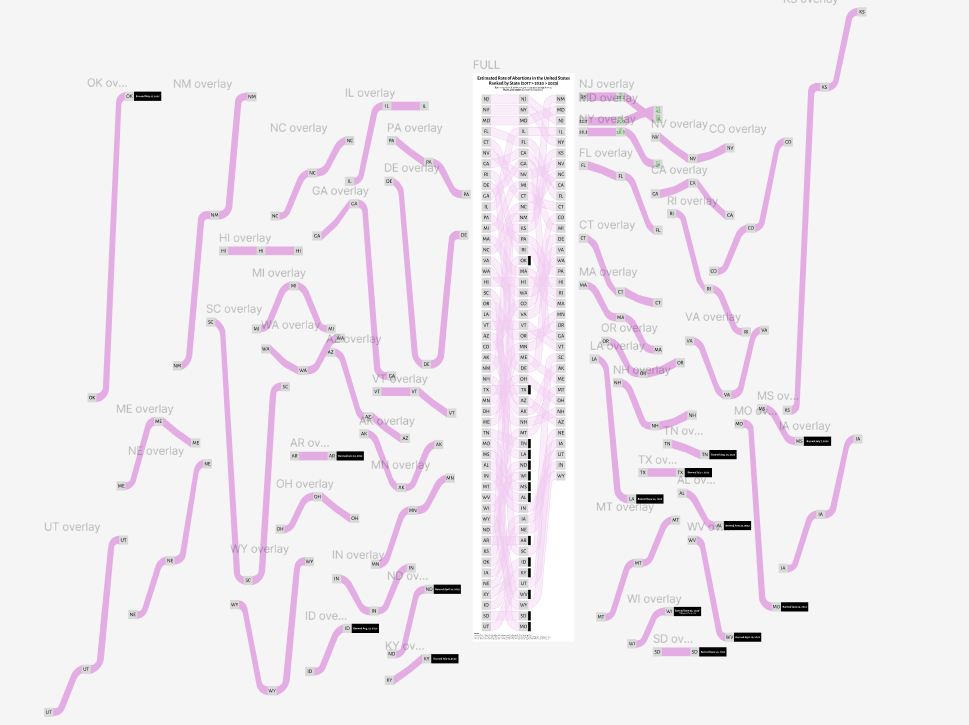 The full Figma file for this project featured a lot of overlays to make each interaction function.
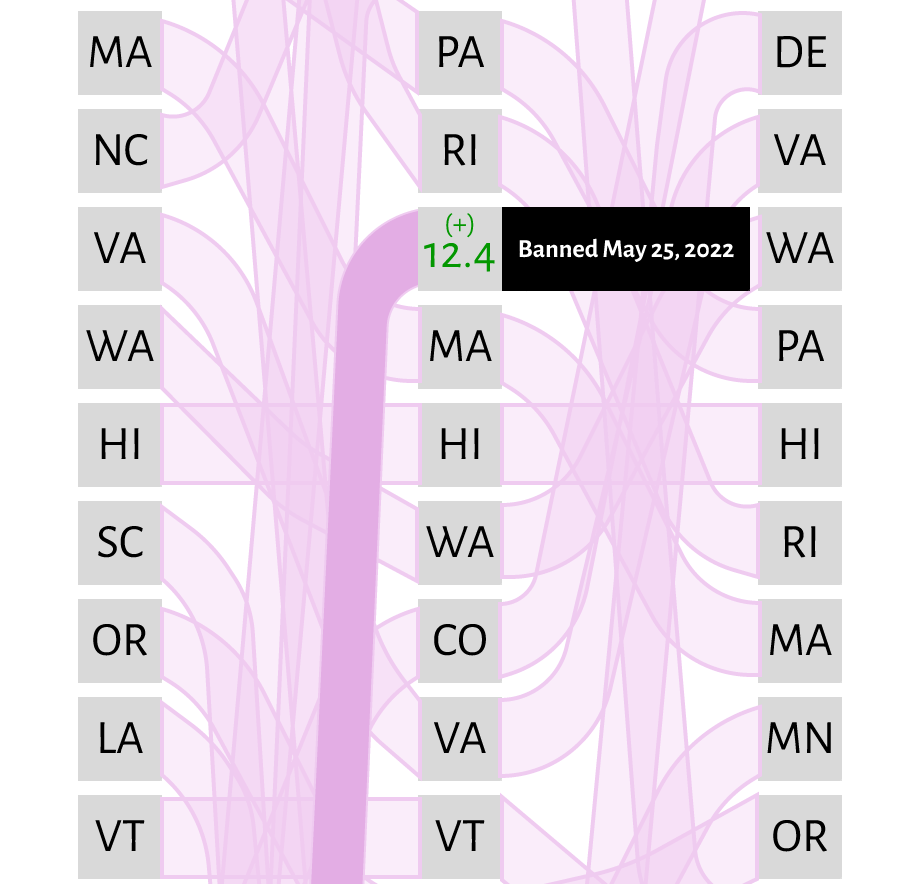 To get the full impact of the bans as they occured in later years, I contrasted the pink flow of color with a black bar that expands upon hovering to show the date that the given state's ban was put into place.